Disease Prediction
Aug 2023 to present
Overview
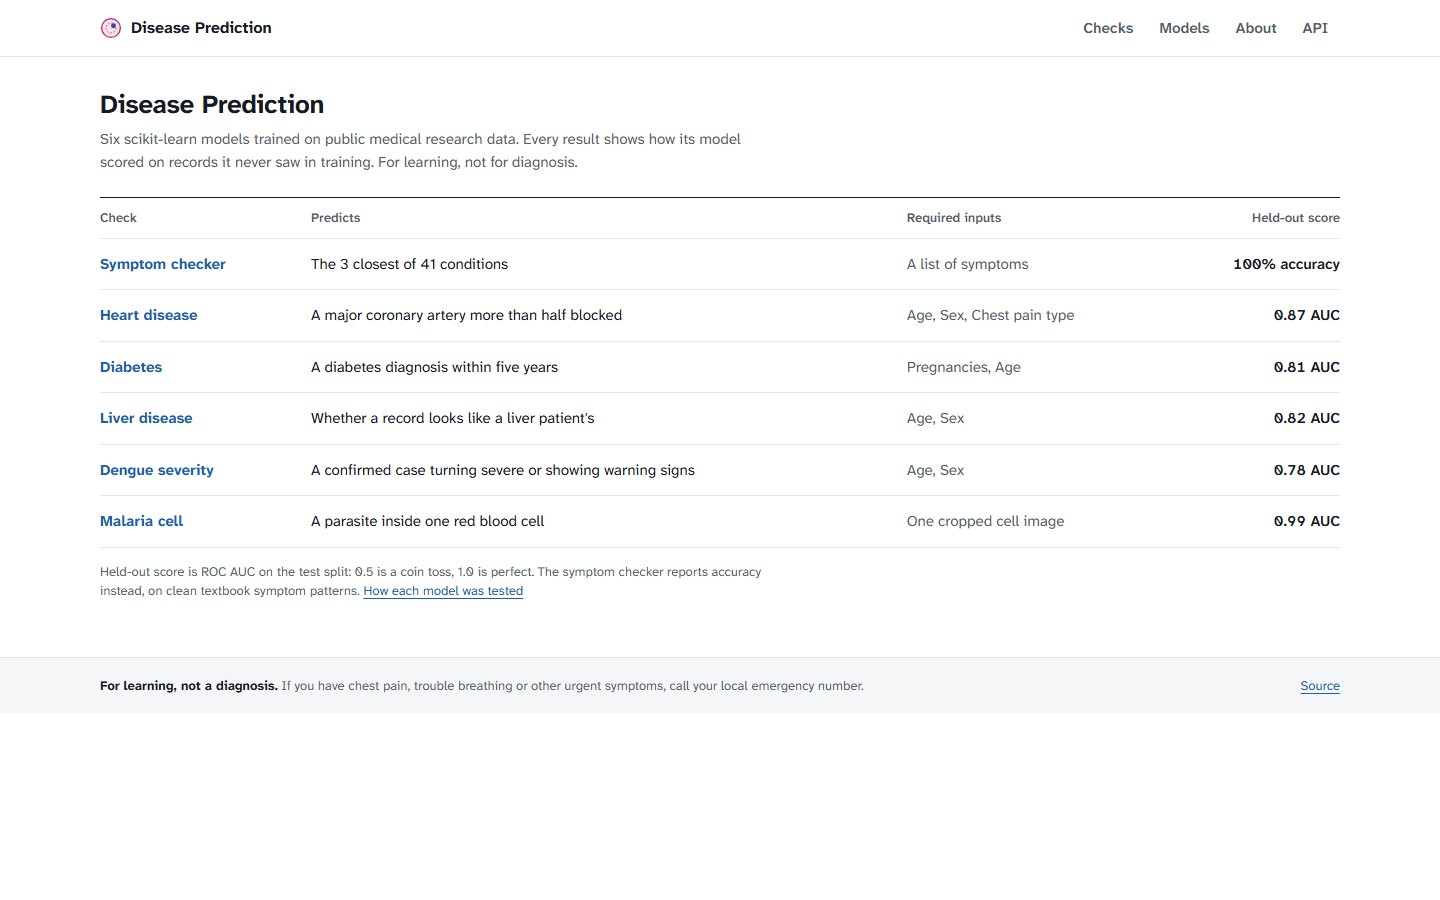
This project serves six machine learning models through one FastAPI service. Send a list of symptoms and get a ranked list from 41 conditions. Or submit clinical measurements for heart disease, diabetes and liver disease risk.
The dengue model estimates severity among patients who already have confirmed dengue. It trains on Brazil's 2023 case records. The malaria model reads one red blood cell image and says whether it holds a parasite.
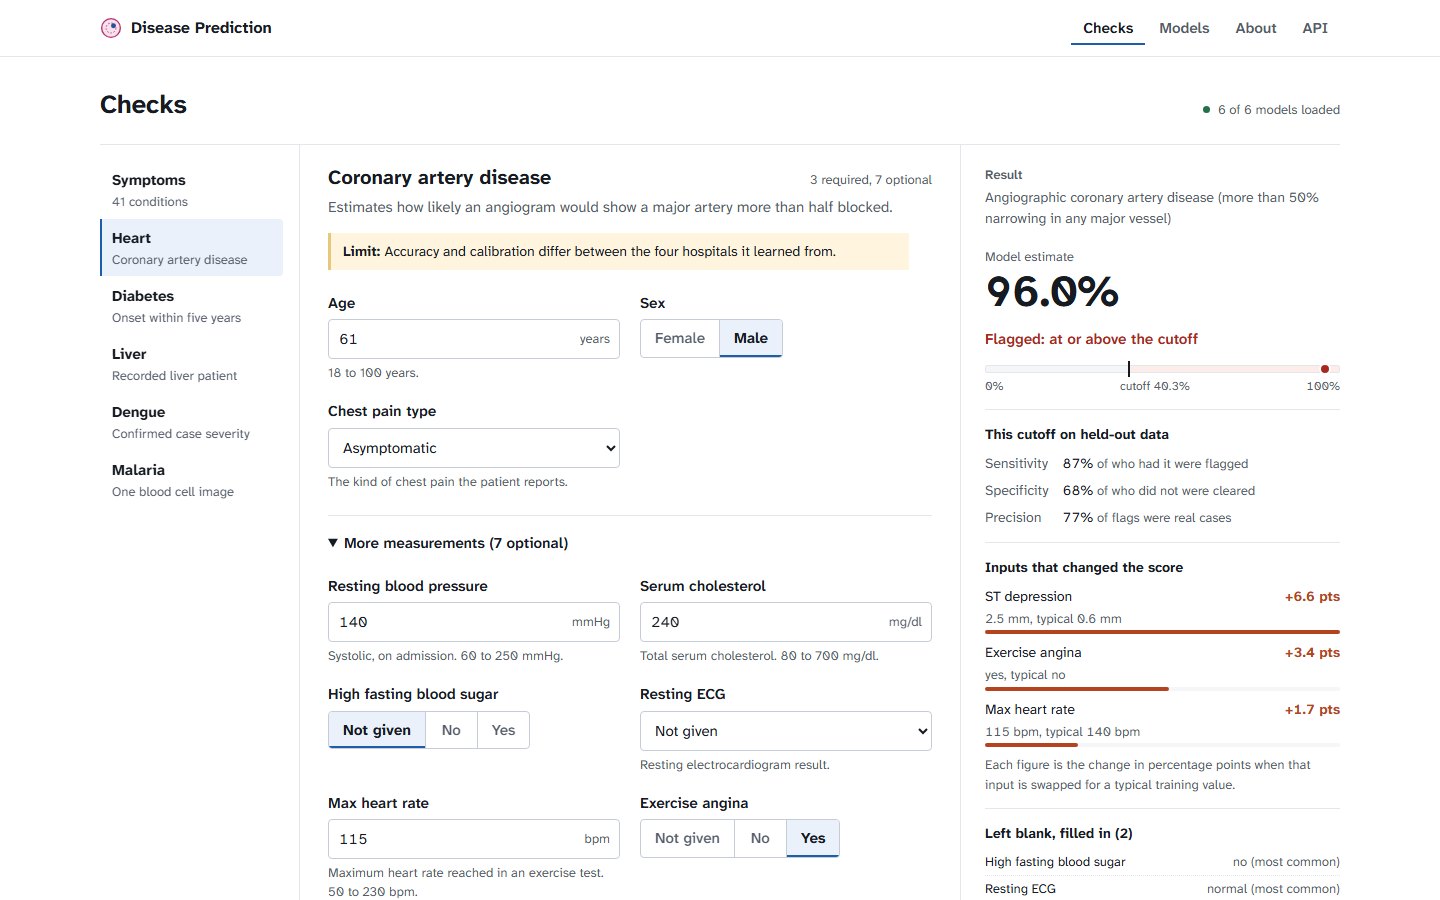
Every result shows the model's cutoff, how often that cutoff was right on held-out data, and what it filled in for any input left blank.
Test Results
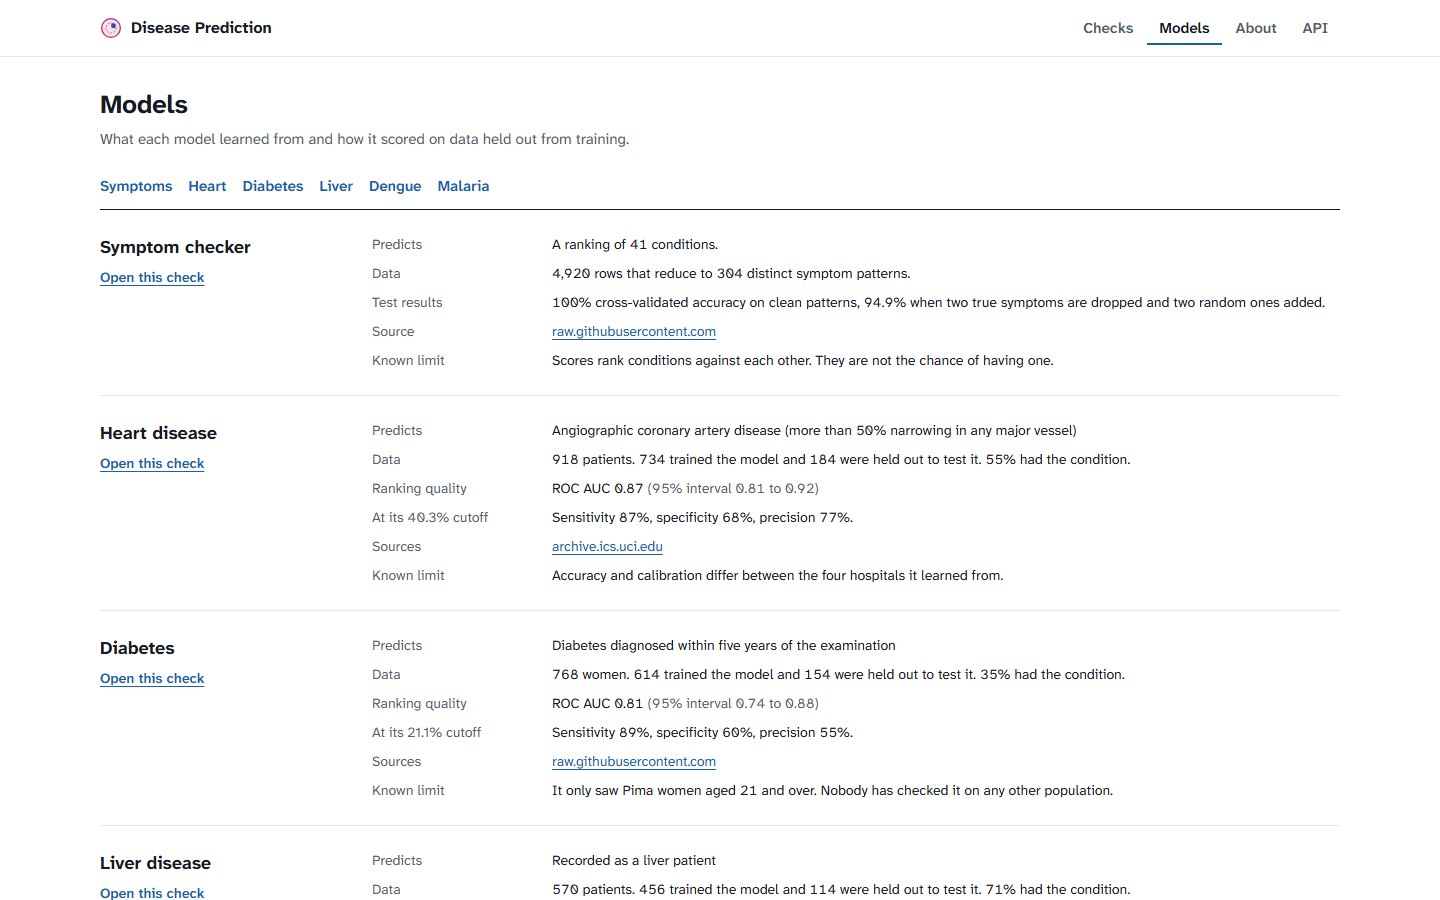
Each model is tested on patients it never saw. AUC measures how well a model ranks positive cases above negative ones.
- Heart: 0.87 ROC AUC on 918 patients from 4 hospitals
- Diabetes: 0.82 ROC AUC on 768 patients
- Liver: 0.82 ROC AUC on 570 patients
- Dengue: 0.78 ROC AUC on 200,000 confirmed cases
- Malaria: 0.99 ROC AUC on 27,558 cell images from 200 patients
How It's Built
FastAPI serves the web interface and the API from the same address.
- Models: scikit-learn pipelines. The trained models ship with the repository, so the API runs without retraining
- Evaluation: separate tests for calibration, data leakage, and performance across hospitals or years. Dengue uses nested cross-validation on 160,000 training rows
- Interface: a checks page for all six models, a models page with each model's data and results, and an about page on reading results
- Logging: optional Postgres logging stores predictions for review behind an administrator key
Interesting Challenges
- A misleading perfect score: the symptom model reaches 100% on its dataset, which reduces to 304 unique patterns. The page says so instead of advertising the number
- Small test sets: the heart, diabetes and liver test sets hold 114 to 184 patients, so their confidence intervals are wide
- Reading a score: each risk model flags at a cutoff chosen in training, and every result shows where that cutoff sits on the scale
Screenshots